
Land Use Explorers


The WAFERx Project strives to evaluate interactions among food, water, energy, biodiversity, and social systems (FWEBS) to inform sustainable climate solutions.
- Principal investigator: Selena Ahmed, Montana State University.
- Land Use Explorers author: Rose Vallor, Montana State University.
- Publication editor: Suzi Taylor, MSU Science Math Resource Center.
- Content contributors: Selena Gerace, University of Wyoming; Meghann Jarchow, University of South Dakota; Teresa Warne, Montana State University.
- Thanks to Peder Nelson, Oregon State University / GLOBE.gov
WAFERx is supported by the National Science Foundation under the EPSCoR Track II Cooperative Agreement No. OIA-1632810. This project is also supported in part by NSF EPSCoR Cooperative Agreement OIA-1757351. Any opinions, findings, conclusions, or recommendations are those of the author(s) and do not necessarily reflect the views of the National Science Foundation.
Welcome to Land Use Explorers!
We are a team of scientists, engineers and educators from Montana, Wyoming and South Dakota, and we study how food, water, energy, plants, wildlife, humans and entire communities come together and affect one another. Our goal is to understand how these systems would be impacted by new agriculture and energy systems that might help us fight climate change. We care deeply about our Earth and the people, plants, animals, and micro-organisms who live on it, and we want to share what we do with you!
This curriculum was created to help people—especially young people—participate in activities that encourage you to think about the land where you live, work and play and how the land's resources support the life you live. Just like our team of scientists and engineers, you will study how the production of food, water and energy are connected to animals, plants and humans who live on the land. When one aspect changes, others are affected. And what might be positive for one could be negative for another. This is your chance to explore, think and discover!
You will also have opportunities to be a “citizen scientist,” a person who makes observations and collects information that can help other scientists around the world better understand our Earth. Land Use Explorers includes fun activities to explore the world you live in, both indoors and out.
You will:
- Learn about your soil and how soil, water and plants interact
- Discover and map water and energy use in your home
- Understand the impacts of energy, water and land use choices on the land
- You will also learn to:
- See what’s living on the land around you
- See how you use your own personal space
- Wonder and think about what land means to you, and
- Consider how you can contribute to learning about our land.
Lastly, you will meet some of the people who do this work. Maybe you will see something that you would like to do as a job someday, and you can be a researcher with us!
Preparation and supplies
The entire activity book may be downloaded as a PDF. All content from the book is also here in HTML.
NOTE: Land Use Explorers was originally released as a kit in Summer 2021. Although supplies are helpful for scientific inquiry, most activities in the curriculum can be completed with few to no extra supplies. Each activity has its own supply list; most will require only minimal materials, such as paper, pencils, rulers, and colored pencils. Activity 7, Soil Shakes, requires a few supplies for doing a soil/water experiment, and Activity 9, What Does the Land Look Like from Above? requires craft materials.
Most activities work well for either a student working individually at home or a group of youth. Youth educators should be sure to read the "Prep for Activity" sections carefully prior to the activities to be sure you have the necessary materials ready to go.
Some activities require technology. In many cases, resources can be accessed or printed ahead of time, such as at a school or library, or a group leader can prepare one copy, if all youth do not have access.
Contents
Through 11 activities, you will learn aboutOur World,Water,Energy,Climate Change,Food Production,Agriculture and Soil, andLand Use.
- Micro- and Macro-Habitats: What do I notice and wonder?
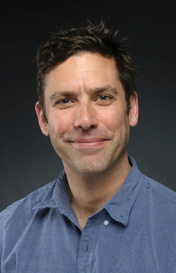
- Researcher profile: Dave Swanson
- How Do We Use Our Space?
- Water Ins and Outs
- Where Does Our Energy Come From?
- WAFERx and Energy
- Researcher profile: Julia Haggerty
- How Does CO2 Impact Climate Change?
- Researcher profile: Ben Rashford
- WAFERx and Climate
- Where Does Our Food Come From?
- Researcher profile: Selena Ahmed
- Soil Shakes—What’s Your Soil Made of?
- Researcher profile: Jack Brookshire
- How Does Your Water Flow (in Plants and Soils)?
- What Does the Land Look Like from Above?
- What Do You Value About the Land?
- Researcher profile: Meghann Jarchow
- How Can I Take Action? Be a citizen scientist!
1. Micro- and Macro-Habitats: What do I notice and wonder?
Observation is the first step in learning about the world around you. Observation is a skill you can get better at – you can hone your observational powers like a scientist or an artist. As you observe more, you often begin to marvel and wonder about what you are seeing. Asking questions is what scientists do when they see something that interests them.
In this activity, you’ll act like a scientist by noticing what’s outside your window and wondering about what you are seeing. Your wonderings will become questions you can seek answers to through research and more observations. In this activity you will explore a micro-habitat and take a look at the macro-habitat around you.
Materials
- Several sheets of paper (8 1/2 x 11 works, but any paper will do, such as a journal or notebook – your observations can also be recorded on a computer).
- A clipboard is handy to take in the field.
- A pencil or other item to write with.
- A hand-held magnifying glass, if available
- A length of string or surveyor’s plastic tape, about 4 feet long. Tie the ends together to form a ring or circle.
- Access to the internet or reference books to find the answers to your wonderings.
Prep for activity
Find a spot outdoors, in a yard or at a park, where you can observe growing plants in the soil.
Time and place
- Length of time: 20-30 minutes to observe and write, 20-30 minutes or more to research.
- Place: Where you live, or a spot you find interesting, with growing things
STEPS
- In your yard or at the park, lay down your circle of string around a spot in the grass or ground cover that you think is interesting. The area within the circle is your micro-habitat.
- Lay down on your stomach, or bend down, and take a close look at all that’s living in your circle, or micro-habitat. Pay attention and take note of all the living things in your circle – plants and insects (anything else?). Are there a lot of different types of plants and insects? How ‘bio-diverse’ is your micro-habitat?
- Take a look at the soil in your micro-habitat. How do the larger living things interact with the soil? Rub some soil between your fingertips – what kind of texture does it have (gritty, soft, smooth, chunky, and so on). What else do you notice about the soil?
- What about water – do you see or feel any moisture in the soil, or on the living things? Where is the moisture, if you feel it?
- As you notice what you are seeing, ask yourself any wonderings about your observations. Wonderings begin with question words, like Why, How, What is it, What would happen, What if, Where, When, Who. These are questions you can explore later.
- On one sheet of paper, draw a large T, with the cross bar at the top of the page and the long stem line dividing the paper in two columns. Label the top of the left-hand column ‘I Notice;’ label the top of the right-hand column ‘I Wonder.’
- Write down the most interesting things (to you) that you noticed in the ‘I Notice’ column. Write down your wonderings in the ‘I Wonder’ column. They can be across from each other, if they correspond.
- Now take a look at your macro-habitat.
- Stand and slowly turn in a circle while you take a long look at all the living and non-living things in this big circle. This big circle is your macro-habitat.
- Notice all that lives in the big circle. The numbers of different things living in this circle is the biodiversity of the land around you. A big variety of living things means the ecosystem is healthy.
- How does this big, macro-habitat compare to the little micro-habitat? Are there the same living and nonliving elements? Do those elements interact in the same way in both habitats? Do they provide the same functions for the habitats? How are the two habitats different?
- Create another T-chart on a sheet of paper and write down what you notice and what you wonder about your macro-habitat.
Research your habitats
Pick one of your wonderings to learn about. Decide how you will look for information on the internet and do some exploring there.
Once you have answered your first wondering, pick another and do the same thing. As you research and explore, look for ways your observations and answers are connected.
When you’ve answered all the wonderings you are interested in, and written down what you’ve discovered, give your discoveries a name, such as ‘Outside My Window’ or ‘The Wonders of My Neighborhood’ or another title that comes to mind.
(adapted from: http://beetlesproject.org/)
Explore more: Outdoor science resource: http://beetlesproject.org/

2. How Do We Use Our Space?
How do we use our space? How do you use your personal space? How much space do our various uses need?
In this activity you will draw a bird’s eye view of your living space, to scale, and calculate how much room each of your activities takes up in your space.
Materials
- Sheets of paper (at least 8 1/2 x 11, though larger sheets of paper allow you to draw a bigger picture)
- A ruler
- A pencil and eraser
Prep for activities
Decide which room you want to draw.
Time and place
- Length of time: 40–50 minutes, more if you want to draw more.
- Place: Your own home, during the day or in the evening.
STEPS
- Create a grid on your paper (100x100cm, or 10x10 inch).
- Decide on a scale, i.e. 1 inch = 2 feet, or 3 cm = 1 meter.
- Measure your space. It can be the room you are sitting in or the house or apartment you are living in.
- Measure the length of the walls and figure out how to draw them to scale in your grid. For example: if your room is 12 x 12 ft, and your scale is 2 ft/inch, you will draw a 6 x 6 inch square on your paper.
- Measure and mark in the doors and windows on the sides of the grid.
- Measure the furniture in your room, convert the measurements to the scale you chose, and draw the furniture to scale in your grid.
- Compare your drawing to your actual room—does it match? Do your proportions fit the scale of the different objects in the room? If not, check your placements and measurements and make some adjustments.
- Make a list of the different activities you do in your space: walk, read, make and eat food, sit at the table, work at your computer, watch TV.
- Calculate how much space each activity needs. Measure how much space each of those activities needs in your room.
- Think about activities in your space over a day. How does its use change?
- Imagine other activities you would like to do in your room. Decide how much space each activity would need and calculate the amount of space it would need. Would you be able to do that activity in your room?
- Look at the outdoor activities around your home. What amount of space is needed for these?
Explore more
Your Fantasy Space: What else would you love to do in your room? Grow a garden? Build a bicycle? Create a castle? Construct a skateboard ramp?
Imagine what your fantasy would look like. Decide what the space requirements would be and convert them, using the scale you created, to fit in your grid.
Draw the different elements into your grid. How would it work? Does it work? What would you change if you could?
3. Water Ins and Outs
We all need water, right? Where does our water come from? How does it get to your house? Where does it go once it’s in your house? How does it leave your house, and where does it go? Who used it before you, and who will use it after you?
Materials
- Paper to draw on (8 1/2 x11 is fine, or larger)
- Pencil with eraser (in case you want to change your drawings)
- A ruler could be handy
- Colored pencils, markers or highlighters (blue, especially)
- Access to the Internet - a phone or computer
Prep for activities
This activity is a scavenger hunt, an at-home field trip, a mapping project and a research project, all in one. You will need a way to access internet sites to complete the research section of this activity
Time and place
This activity takes place in and around your home. Completing all the parts of this activity could take 3-4 hours.
STEPS
- Go on a field trip around your home to find your water.
- As you explore your home, check off the items on the scavenger hunt list:
Scavenger Hunt List
-
- Where the water pipes come into your house
- Where the drain lines meet the sewer line, and used water leaves your house
- Turn-off valve for your house
- Kitchen sink faucet and drain
- Bathroom sink faucet(s) and drain(s)
- Toilet(s)
- Shower and/or bath faucet and drain
- Outside water faucets
- Any other sinks with faucets and drains
- Hot water heater
- Clothes washing machine (if you have one)
- Dishwasher (if you have one)
- House sewer line to septic field or city sewer line
- Water hydrants near your house
- Storm drains near your house
3. When you have found all the items, sit down at your table and draw an outline of your house, in as accurate proportion as you can. Draw in the various rooms. You can also draw it on your computer. If you have more than one floor, just draw the main floor for now.
4. On your map, mark where you found the items on your scavenger hunt.
5. You can’t see them, so imagine where the pipes are located in your house.
6. Using a blue pencil, draw lines from the spot where the water comes in to the house to the faucets, toilets and water-using appliances.
7. Using a different color, draw lines from the drains, toilets and water-using appliances to the spot where the water leaves your house. Draw in the sewer line from your house to the septic field or city sewer line.
8. Take a look - you’ve completed your water map for your house! What do you notice about how the water flows in your house?
NEXT STEPS
Now do some research. Did you know that your house is connected to a network of underground pipes that bring water to your house and carry used water away from your house? To find out more, go to your local water utility website and see if you can find where they get the water that comes to your house.
- Is your water source from underground wells? Is it from a dam on a river or creek? Is it from a local river or lake? From a combination of places? How much from each?
- Does anyone use the water before it comes to your house? Does your water go through a water treatment plant before it reaches your house?
- How much water does your family use? How can you find out?
Do the same type of research for your wastewater—where does it go and how does it get there? Who uses it after you do?
Questions to ask
- Is your water use sustainable, or are there issues about how much water is available now and how much will be available in the future?
- Are there better ways to use your water? What happens if you use a lot of water, or if you save water?
- How does your local water use affect ecosystem biodiversity in your area—the communities of plants, animals, insects and birds (for instance, through wetland loss or dam creation)?
Explore more
Sustainable Water Use: www.aquatechtrade.com/news/water-treatment/sustainable-water-essential-guide/
https://waterfm.com/water-sustainability-achieve/
The importance of sustainable water use: www.thegef.org/news/importance-water-sustainability
Call to action
Research ways to minimize the amount of water you use in your home and write up an action plan for you and your family.
Explore the water use of your city or town. Attend meetings to promote wise water use in your area.
Crowd the Tap is a Citizen Science project you can join that collects data on water infrastructure: scistarter.org/form/crowd-the-tap

4. Where Does Our Energy Come From?
In this lesson you will examine the types of energy you use in your life, identify where your energy comes from, and consider the role of renewable energy in supplying your energy needs.
What is energy and what do we use it for?
Scientists and engineers define energy as the ability to do work. Modern civilization is possible because people have learned how to change energy from one form to another and then use it to do work. People use energy to walk and bicycle, move cars along roads and boats through water, cook food on stoves, make ice in freezers, light our homes and offices, manufacture products, and send astronauts into space.
There are many different forms of energy. Energy can be grouped into two general types:
|
Potential, or stored energy |
Kinetic, or working energy |
|
Mechanical Nuclear Chemical Gravitational Elastic |
Heat Sound Motion Electrical Electromagnetic Light (Radiant) |
Energy can be converted from one form to another. For example, the food a person eats contains chemical energy, and a person’s body stores this energy until he or she uses it as kinetic energy during work or play. The stored chemical energy in coal or natural gas and the kinetic energy of water flowing in rivers can be converted to electrical energy, which in turn can be converted to light and heat.
To measure energy, theheating valueof the fuel is used, which indicates how much of a certain fuel is converted to how much heat. Common units of energy are thecalorie andBTU.
Energy is a resource that comes from many sources. A source is a place where one can get a valuable item, for example: A coal mine is a source of coal; while a resource is a valuable item that a person uses. An example: Coal is a resource. The many different sources of energy can be divided into two basic categories:
Renewable energy sources can be easily replenished
Nonrenewable energy sources cannot be easily replenished
Both renewable and nonrenewable energy sources can be used as primary energy sources to produce useful energy such as heat, or they can used to produce secondary energy sources such as electricity and hydrogen.
(from: https://www.eia.gov/energyexplained/what-is-energy/)
Energy Resources in the Upper Midwest of North America |
|
|
Non-renewable |
Renewable |
|
Petroleum – in the form of crude oil refined into gas products Natural gas – found with petroleum Coal – burned for heat to produce electricity |
Wind farms - produce electricity Geothermal – produce heat and electricity Hydroelectric – generators in place in dams in rivers Solar – electricity and hot water heat Biomass/Biofuels – ethanol and biodiesel, from organic matter Recovered Energy – heat-recovery or waste-heat recovery |
Materials
- Paper to draw on (8 1/2 x 11 is fine, or larger)
- Pencil with eraser (in case you want to change your drawings)
- A ruler would be handy
- Colored pencils, markers or highlighters
- Access to the Internet - a phone or computer
Prep for Activities
This activity is a mapping project and a research project. You will need a way to access internet sites to complete the research section of this activity
Time and place
This activity takes place in and around your home or the building where you do this activity. Completing all parts of this activity could take 2-3 hours, spread over a few days if you like.
STEPS
Mapping Our Energy Project:
- On a piece of paper, create a T-chart. Draw the top bar of the T a bit below the top of your paper, and the center line of the T down the center of your paper, so you have two columns.
- Label one column Energy Use at the top, and label the other Type of Energy.
- Take a close look around the building that you are in and take note of where energy is being used.
- At the bottom of your paper, write down your predictions for the most common energy-using items and the most common type of energy being used.
- Now begin listing each item that uses energy. Write down the type of item in the Energy Use column, and across from it, write down the Type of Energy it uses in the other column—electricity (either batteries or plug-in), natural gas, gasoline, wood, solar heating, solar electricity, wind, motion (like a bike), or something else.
- Draw a line under that item and write down the next item you notice. Across from that item write down the type of energy it uses, and then draw a line under them.
- Continue looking around your building, making a list of all the items that use energy and the type of energy they use, until you feel you’ve recorded all the energy-using items.
- Place a star by, or mark with a specific color, all the items that use electricity and are plugged into a socket.
- Consider all the different items that use energy in your building and all the different types of energy being used. Count up each type of item and list them on another sheet of paper by the most common item first.
- Count up each type of energy and make a list of the different types, starting with the most commonly used type of energy.
- What is the most common item? What is the type of energy that’s used most frequently? Do these match your predictions? Why do you think they do or do not? How would you describe the energy use in your building? The starred items use energy that comes into your building. You are now going to focus in on the electrical energy that circulates through your building.
NEXT STEPS
Research Project: Where does our energy come from?
Now it’s time to find out where the electricity is generated, and where the natural gas that you use comes from. You will need Internet access for this project.
- Conduct an Internet search of the city services for the area where the building you are analyzing is located. Look for the energy providers for the area. This may take some detective work! If you are researching your own home, you may be able to look at the utility bills for this information.
- Compile the information you find. As you research, write down what the energy source is. Is it hydroelectric? Is it from coal-fired generating plants? Often, our energy comes from different sources.
- Record if the energy sources are renewable or non-renewable, and how much energy comes from each type of source. (Use the chart on page 7)
- Record any information you find about the polluting aspects of your energy source or any effects on the environment for the type of energy generation your building uses.
Once you have all the information about energy sources you can find, take a good look at what you’ve discovered. Look around the building you analyzed to get a sense of how the life you are living in this building is supported by the types of energy generation you’ve uncovered.
Questions to ask
- Is your energy mostly renewable, non-renewable, or a mix of the two?
- Why do we care about renewable resources being used for energy generation?
- How clean is the energy your building uses? Does it generate a lot of pollution or harm the environment in some way?
- If the energy source is significantly renewable, is it cleaner and less environmentally harmful than a non-renewable source? Why?
- What conclusions can you draw about the energy sources you are using? Do you think you use a lot of energy, or not very much?
This website lets you determine how much energy people in your state consume on average, and what the environmental effects are for that level of consumption: www.energy.gov/maps/how-much-do-you-consume-0
Explore more
Do some research on renewable energy sources. For each type of renewable energy, consider:
- How easily is the renewable captured and converted for use?
- How available is the renewable energy—is it limited to certain parts of the world?
- What are obstacles and challenges to better utilizing the renewable?
- What are the main advantages of utilizing the renewable, compared to nonrenewable sources or even other renewables?
- Are there any negative consequences of utilizing the renewable?
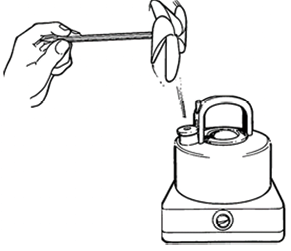
Pinwheel Energy Transformations Project
Falling water, blowing wind, and heat generated from burning fuel are all forms of energy, but how do these transform into the electrical energy that runs so much in our lives? This activity shows how one type of energy, moving air, is converted to another type of energy, motion, using a pinwheel.
This type of energy conversion takes place in various types of turbines. The spin of a turbine causes a coil of wire to move relative to a magnetic field inside the turbine, generating electricity. In a hydroelectric power plant, falling water causes turbines to spin. In fossil fuel or nuclear power plants, turbines are spun by the pressure of steam caused when water is heated by burning fuel.
Materials
- A pencil with an eraser
- A thumbtack or straight pin
- A square piece of paper, 6 inches by 6 inches
- A ruler
- A pair of scissors
- Optional: a source of steam, like a tea kettle
Prep for activities
You will need a source of steam if you choose to do the optional part of this activity. Since steam can burn, and is generated by boiling water using a source of heat, please take good precautions when using steam.
Time and place
Length of time: 15 minutes to cut out and create your pinwheel, plus an extra 5-10 minutes if you choose to experiment with the steam option.
Place: alone or with a group, at home or other sites. If you do the steam option: a source of water and heat, as in a kitchen or lab.
STEPS
- Trace a 6 inch by 6 inch square on a piece of paper.
- Place a large dot in the center of the square.
- Draw lines from each corner to about 1 inch from the large center dot, dividing the square into triangles.
- Place a small dot in the far right-hand corner of each triangle (one small dot per triangle)
- Cut out the pinwheel square along the outside lines, and then cut along the lines toward the black dot in the center, being careful not to cut too far into the center. You will have four triangles of paper, each with a small dot on one outside corner, that are connected in the center.
- Bend each far corner with a dot toward the center, line up the corner dots on top of each other, insert a pin or thumbtack through all the dots, and then through the black center dot.
- Stick the end of the pin or thumbtack into the end of the eraser of your pencil.
- Blow on your pinwheel to see how well it spins. Adjust the pin or thumbtack so the pinwheel move freely and the triangle sails to catch the wind if you need to.
Optional: You can see how heat converts to motion by holding your pinwheel in the steam coming from water being heated in a teakettle by a hotplate or on a stove. (You may need to experiment with how you hold your pinwheel to find the most effective position for your pinwheel in the path of the teakettle’s steam.)

WAFERx and Energy
One of the climate change solutions WAFERx researchers study is called Bioenergy with Carbon Capture and Storage (BECCS rhymes with “necks”). BECCS can help us decrease climate change, because it removes carbon dioxide (CO2) from the atmosphere while also producing energy (either electricity or fuel).
The first step in BECCS is the production of bioenergy crops (plants that we use for fuel, not for food). All plants absorb CO2 from the air during photosynthesis, so when these crops are harvested and transformed into energy, the CO2 from them is then captured and stored permanently underground in geologic formations. This could—depending on how and where bioenergy crops are grown and transported—result in more CO2 being removed from the atmosphere than the plants release. We call this negative emissions.
BECCS, while potentially lowering CO2 emissions, would require big changes in agriculture, land-use, and energy production systems, which could create trade-offs among food, water, energy, biodiversity, and economic opportunities.
For example, if we grow bioenergy crops instead of food crops, we may not have enough food for people to eat. Storing CO2 underground and growing crops for bioenergy could require changes in water use, affecting water quality and quantity. If grasslands and wetlands became lands for growing bioenergy crops, wildlife habitat would be affected. And if we use fewer fossil fuels and more renewable energy, that could impact jobs and local and state tax revenue, which would then affect our communities.
The WAFERx team is studying how all these potential trade-offs would affect the people, communities, cultures, and ecosystems of the Upper Missouri River Basin.

Meet the scientists: Julia Haggerty
Dr. Julia Haggerty is an Assistant Professor of Geography in Montana State University’s Earth Science Department and is also director of the Montana Institute on Ecosystems. She studies how the use of natural resources affects the social and economic well-being of rural communities, such as how changes in the production of energy sources like coal, oil and gas affect people in nearby towns.
Dr. Haggerty loves working with students, and has dedicated her career to building and supporting the next generation of leaders in environmental and natural resource policy and management. Dr. Haggerty and her students have written several reports on how people and nature are connected. In 2015, Dr. Haggerty was recognized nationally as one of the top 100 inspiring women in STEM.
For the WAFERx project, Dr. Haggerty’s team studies what might happen to rural communities if we moved to a BECCS (Bioenergy and Carbon Capture and Storage) system (see the WAFERx and Energy section) in the Upper Missouri River Basin.
5. How Does CO2 Impact Climate Change?
What is climate change? What change in global temperatures have been happening to the world over the past 50 years or so, and why? You may have heard of the greenhouse gas effect, in which gases trapped in the earth’s atmosphere have caused the overall temperature of the earth to rise over time. The primary gas that’s contributing to the greenhouse effect is carbon dioxide, or CO2.Evidence, or data, collected at research stations around the world in the past 50 years show trends that both CO2 levels and atmospheric temperatures have increased.
Where does the extra CO2 come from and where does it go? CO2 can go one of three places in the world—into the atmosphere, into the land or into water like our oceans and lakes.
In Part 1, you will witness an experiment that shows that increased CO2 in a closed system will cause the air temperature in that system to rise higher than the system with less CO2.
In Part 2, you will play a game that shows which of those places the extra CO2 ends up in. For Part 3, you will explore the temperature records for the last 50 years in your area, and then draw conclusions about the effects of increasing CO2 on our world.
Materials
- Access to the internet, either individually or as a group.
Part 1
Part 2
- 60 (or more) identical paper tickets or equivalent small item.
- Timer
- Notebook
Part 3
- 60-year records of atmospheric CO2 at the website Daily CO2 (www.co2.earth/daily-co2).
- Google Earth software or app (download)
- Google Maps .kml file (CRUTEM4-2018-06_gridboxes.kml) from https://crudata.uea.ac.uk/cru/data/crutem/ge/. Use a more recent .kml file from the same website if available
Time and place
- Length of time: Total time: 2 hours max. (Part 1: 15 minutes; Part 2: 30 minutes; Part 3: 30-45 minutes)
- Place: Someplace with internet access and a computer (a smart phone will work, but the small screen may be challenging)
Steps for Part 1
If working with a group, explain the set-up of the Greenhouse Gas Demonstration before watching the video, especially that the effervescent tablets will be releasing CO2 into the air trapped above the water in one bottle, with no increasing CO2 in the other bottle. Predict what will happen to the temperatures in the bottles when the light is directed on both bottles equally, for the same amount of time.
Watch the video, and discuss if your predictions were accurate. Can you compare the closed systems of the two bottles to Earth’s systems? Why or why not? In what ways are they similar and in what ways are they different? Is the comparison close enough to consider that the same mechanisms are happening for the earth?
Keep this demonstration in mind as you continue with the next two parts of this activity
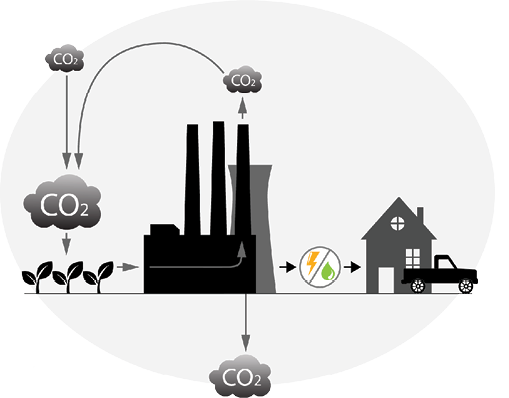
Steps for Part 2
What happens on Land? Carbon can either be taken up or released by the land, water and atmosphere of Earth’s system. When carbon is removed by being taken up by the system, it is called a carbon uptake, or sink; when carbon is released into the system by types of land use, human impacts and natural processes, those are considered carbon inputs or sources. Fossil fuel use has been measured as the largest source of carbon. The balance between carbon input into earth’s system and carbon uptake out of the system can be considered the carbon budget. Annual, or yearly, carbon budgets are a way to measure if there is a balance between carbon release and carbon use per year.
In the present-day carbon budget, land change as an increasing carbon input, or source, represents the net of human-caused land use impacts. Deforestation is the largest impact. Land changes on the uptake side represent changes due to CO2 increases, including CO2 fertilization of plant growth and longer growing seasons, particularly in northern parts of the northern hemisphere. If one chose to lump all land change processes that affect CO2 into a single number, for example, roughly one gigaton lost combined with four gigatons gained, land will still represent a net uptake (sink).
This activity works great for a group, but if you are doing it alone, read through the activity and predict what will happen. Participants explore sources and sinks of carbon by modeling how carbon moves between land, ocean and atmosphere each year, or annually.
To start the activity, assign the following roles to participants (based on up to 10 participants):
- Ocean (1 participant): can only receive two tickets in each annual exchange cycle;
- Land (1 participant): can receive up to four tickets in each annual exchange cycle;
- Atmosphere (1 participant): can receive an unlimited number of tickets;
- Carbon Mover (all others): one ticket per participant or a few participants each holding several tickets, for a total of 10 tickets at the start.
Activity Directions
Have the Ocean, Land and Atmosphere ticket collectors on one side of the room (tell them how many tickets they can receive, but don’t inform the Carbon Movers). Line the other participants up single-file, facing them. Depending on size of the group and space available, set a time limit for ticket exchanges. For small groups, 2-3 minutes will usually prove sufficient. Prior to starting, set the timer for 2-3 minutes. As each Carbon Mover takes their turn, they should run across and choose to give their tickets to either the Ocean, Land or Atmosphere. For each ticket received, ocean shouts “acidification,” land says nothing, and atmosphere says “warmer.” See above for how many tickets each can accept. Tickets refused by ocean or land must go to atmosphere.
After they distribute their ticket(s), each Carbon Mover returns to the line, where the instructor gives the Carbon Movers a second set of 10 tickets, representing the next annual cycle. Before the second round starts, Land returns one of its first four tickets to the Carbon Movers, giving them now 11 rather than 10. As before, the clock starts and the Carbon Movers again attempt to turn in all their tickets to the land, ocean and atmosphere. This cycle and the addition of 10 new tickets (plus one returned from the land) each round, can be repeated as many times as the group would like, or at least 5 rounds (50+ tickets).
Participants can change roles in each cycle but tickets accumulated should remain with each depository (ocean, land or atmosphere).
Discussion
Gather the participants and discuss:
- Which location accumulated the most tickets – ocean, atmosphere or land?
- Why and what happened as a result? (Mostly atmosphere, because the ocean and land were limited in the amount of CO2 they could absorb. Ocean gains some tickets and becomes more acidic.)
- If each cycle represented a year, did the CO2 inputs over a year (tickets) equal collections (outputs)? (No, the total number of tickets per year increased by 1 and ends up in the atmosphere.)
In the real world, fossil fuel emissions have increased steadily for at least 50 years. If you redid this experiment with increased emissions (starting each annual cycle with one more additional ticket) but with no other changes, where (to which location) would those additional tickets go? (Atmosphere.)
In some years, deforestation increases substantially. How would such an increased loss of forests affect these ticket exchanges? (The land could absorb less CO2.) What if you decrease the number of tickets land can take by one? (Atmosphere will end up with more.)
Frozen land, called permafrost, can hold a lot of carbon. If carbon from permafrost emerges as CO2, where will that carbon accumulate as frozen soils start to thaw? (The land releases CO2 and is also not able to absorb as much CO2.) What if you decrease tickets the land can take by one? (Atmosphere will end up with more.)
Ask participants to consider, has our carbon budget model considered all major sources (income) and sinks (expenses) of carbon, or have we missed something?
What can we learn about the carbon cycle from this activity? (Carbon cycles between its sources: land, ocean and atmosphere over time; the land, ocean, and atmosphere can store extra carbon. The amount of carbon the land and ocean can store is limited. Excess carbon that cannot be stored in the land or ocean ends up in the atmosphere.)
What happens to the atmosphere as CO2 increases (Remember the Greenhouse Gas Demonstration)? How is the carbon cycle related to global warming and the greenhouse effect?
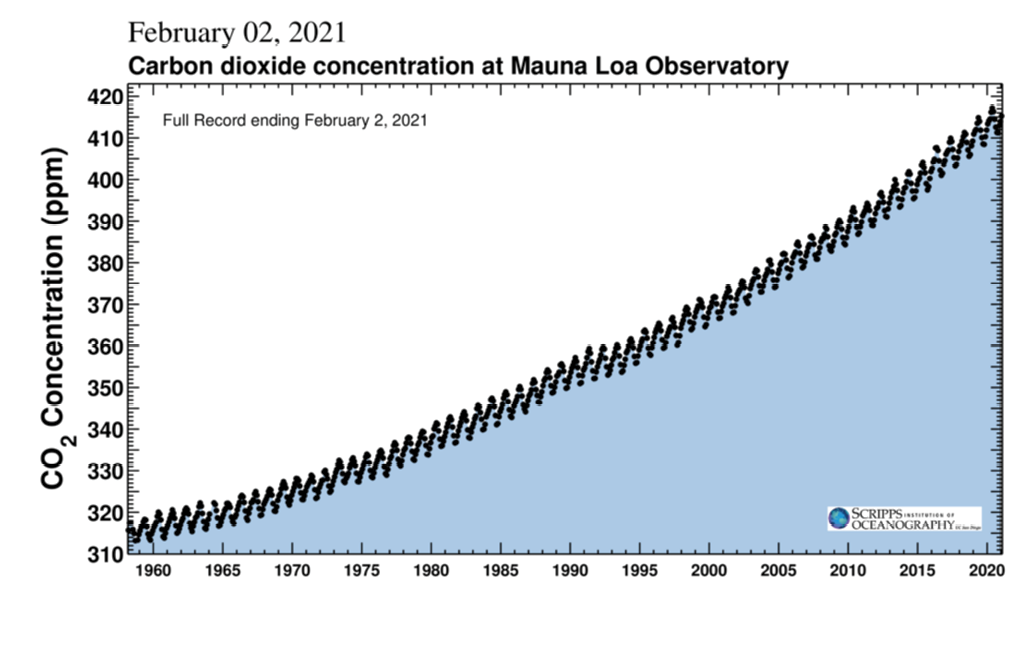
Global CO2 Data. You can use this image for Part 3 (next page). This image shows the entire history of recorded CO2 data from Mauna Loa, updated to Feb. 2, 2021. You can find the same record at Daily CO2, updated to the most recent day or two. Source: Daily CO2: www.co2.earth/daily-co2. Used by permission from Scripps Institution of Oceanography at UC San Diego
If participants have a grasp of this concept and exercise, ask them to consider the following: CO2 lasts 200 or more years in the atmosphere. Assuming carbon inputs to the atmosphere are at least five gigatons per year, how much additional carbon will accumulate in the atmosphere over the next 100 years? (500 gigatons.) The current atmosphere holds 870 gigatons of carbon (this is the equivalent to 410 ppm). Assuming the land and ocean sinks remain stable, how much carbon (in gigatons) will the atmosphere hold 100 years from now? (1370 gigatons.) What might this amount of carbon in the atmosphere lead to? What might happen if the land and ocean lose uptake efficiency (can’t absorb as much as they do now)? (Even more CO2 will end up in the atmosphere.)
Steps for Part 3
Global CO2 Data Compared to Local Temperature Data
Prior to the activity, view (and download if appropriate) the most recent image(s) for CO2data at the Daily CO2 website (www.co2.earth/daily-co2), choosing “Record since 1958” or use the image on the previous page. Then, using the .kml file and Google Earth, view (and download if appropriate) the most recent image(s) or data for average air temperature over time for a location nearest your present location (see example above). View or download data from neighboring or more distant locations for comparison.
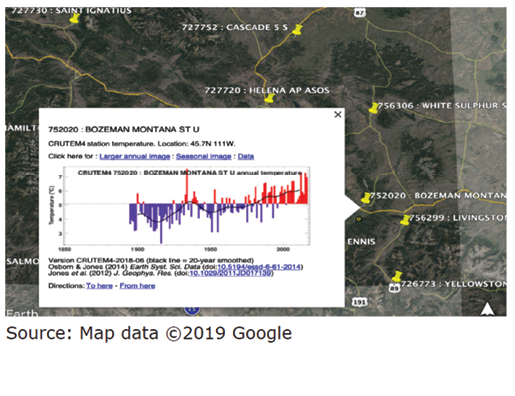
Local temperature data (image above). Example of data for Bozeman, MT. Image from 4-H Weather and Climate Youth Learning Lab curriculum. (Source https://crudata.uea.ac.uk/cru/data/crutem/ge/)
Experience
If you are working alone, you will explore and compare both graphs. If you are working with a group, divide the group in two. Explain to participants that each group is going to look at a graph of real data and then share what they notice. Explain that each graph has lots of information, and there will be a focus on specific parts.
Give one group the global CO2 data. Explain to this group that the air around the planet is a mixture of gases and that CO2 is one of the gases. Explain that this gas has been accurately measured since 1958 at this location in Hawaii. Ask participants to focus on the line. What do they notice?
Give the other group the temperature graph for their location (and if possible, show them how it was accessed on Google Earth). Explain that this graph shows annual average temperatures recorded each year for their location. Explain that this is the average temperature for the whole year, not the temperature on any given day. Ask participants to focus on the line (a trend line). What do they notice? Give both groups some time to explore and discuss their graphs.
Bring the groups back together. Start with the local temperature group. Ask them to share with everyone:
- What does the graph show? (An average temperature for each year since whenever records began.)
- What did you notice about the trend line? (It goes up.)
- What does the trend line on this graph show? (Average annual temperature has increased over time in the location).
Next, ask participants from the global CO2 group:
- What does the graph show? (How the amount of CO2 in the atmosphere changes over the years.)
- What did you notice about the trend line? (It goes up and down a little each year but generally goes up.)
- What does the trend line on this graph show? (CO2 has increased over time globally.)
Facilitate a discussion with all participants comparing the data on the two graphs.
- What is the same? (Both temperature and CO2 increase over time.)
- What is different? (The graphs may show two different time scales, but the time scales overlap.)
- What conclusions can participants draw from this comparison? (Temperature and CO2 have both increased over time in their location.)
- Is this true in other locations, too?
Show participants temperature graphs for other locations (use the graphs for the other states by finding them in Google Earth).
Ask participants:
- Are the trends the same?
- What kind of generalizations can be made about temperature over time in your state or region? (In general, temperatures across these states and the region have increased over time.)
- Does this trend extend beyond Montana, Wyoming, and South Dakota? (Yes, global temperatures have increased over time and show a similar trend.)
Facilitate a discussion around the connection between rising CO2 levels and increasing temperatures.
- Can they identify any relationships between CO2 in the atmosphere and temperature?
- How might one affect the other?

Meet the scientists: Ben Rashford

Dr. Ben Rashford is an Associate Professor in the Department of Agricultural and Applied Economics at the University of Wyoming.
His research interests are in environmental and natural resources economics. More specifically he studies the conservation and management of wildlife, how climate change is affecting land-use and wildlife habitat, and the economic impacts of wildlife disease on livestock.
On the WAFERx project, Dr. Rashford is studying what the economic implications would be of increasing Bioenergy with Carbon Capture and Storage in the region. This includes how land-use would change, how it would affect the profitability of farms, and how it could affect the economy of the entire region.


WAFERx in Action: WAFERx and Climate
WAFERx is a research project studying how food, water, energy, biodiversity, and social systems interact and how these systems could work together to create climate change solutions.
According to the Inter-governmental Panel on Climate Change (IPCC), it is vital that we remove enough carbon dioxide (CO2)from the atmosphere to prevent the global average temperature from rising more than 2 degrees Celsius, which is projected to be the tipping point above which the world would experience significant consequences.
The amount of CO2in the atmosphere has been increasing since the Industrial Revolution, largely due to emissions from burning fossil fuels. As the amount of CO2particles in the atmosphere increase, more heat is trapped in the earth’s atmosphere causing global temperatures to rise.

6. Where Does Our Food Come From?
Many of us live near agricultural lands. Our country’s food is often grown outside of our towns and cities. Are there crops being grown and animals being raised outside of where you live? Do you know where your food comes from?
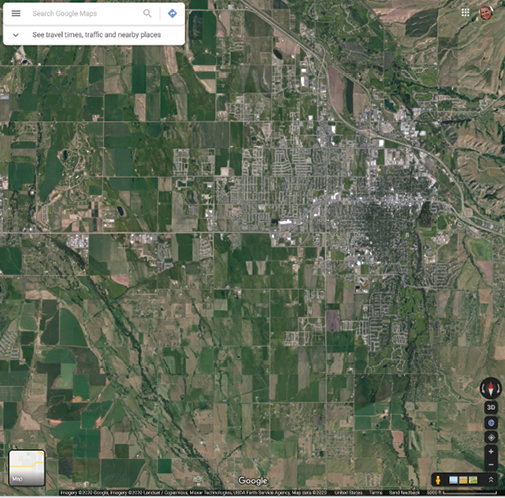
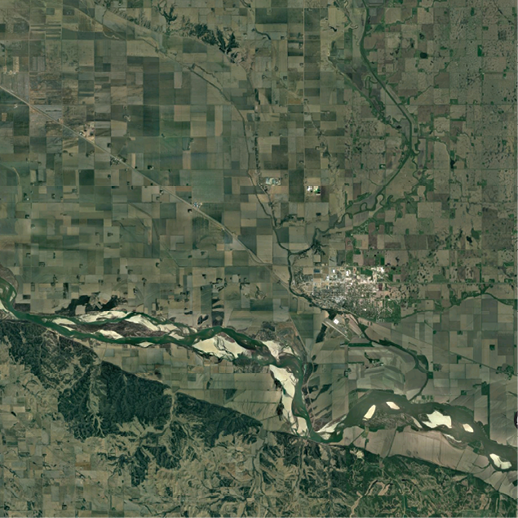
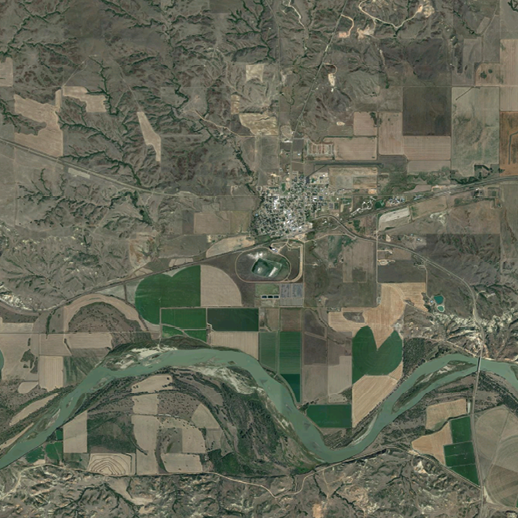
In this activity you will use Google Earth or Google Maps to explore an aerial photo of the lands around where you live. You will find out how far it is from your home and town to where the crops are being grown.
Materials
- Phone, tablet or computer to access the internet
- Ability to access the internet
Prep for activities
Google Earth is not required to do this activity (Google Maps in satellite view is fine), but if you choose, you can download Google Earth (it’s free) and spend a little time getting familiar with it.
Time and place
Length of time: 30 minutes or so.
Place: In your home or another spot with internet.
STEPS
- Open Google Maps or Google Earth.
- Type in your address and find your home on the screen.
- If you are using Google Maps, make sure you have opened your view to satellite view so you can see the actual land (see the red circle above for where to click). If you are using Google Earth, click on the layers that show your streets and towns.
- In either program, zoom slowly out until you can see the land around your home and town that doesn’t have many buildings on it and is mostly either green or brown land.
- Take a close look at the nearest brown or green land. Do you see regular patterns on it?
- What do you think a farmer needs to do with their land to grow crops?
a. Irrigate
b. Plow or till up the land
c. Plant, usually in rows, all one type of plant.
d. Harvest crops that have been planted in rows
e. Other?
7. What types of patterns would these land use practices show on the ground?
a. Circles from pivot irrigation systems
b. Straight lines from tilling, planting and harvesting.
c. Square or rectangle areas that are all one color or shade of green that show that one type of plant is growing there.
d. Other?
8. In Google Maps or Google Earth, note which of these patterned areas are closest to your house. In Google Maps, click on that field and then use the direction function to find the distance to that area. In Google Earth, click on the ruler function at the top of the screen (choose miles), click on the patterned area and drag the other end of the ruler to your home. Note the distance from your home. Find and measure the distance to other patterned areas.
9. What would you say, on average, is the distance from your house to where farmers are growing crops? Do you think that’s a long way? Do you think it’s close?
10. Do some research to find out what that crop is and what happens to it before it can be eaten. How is it processed and where?
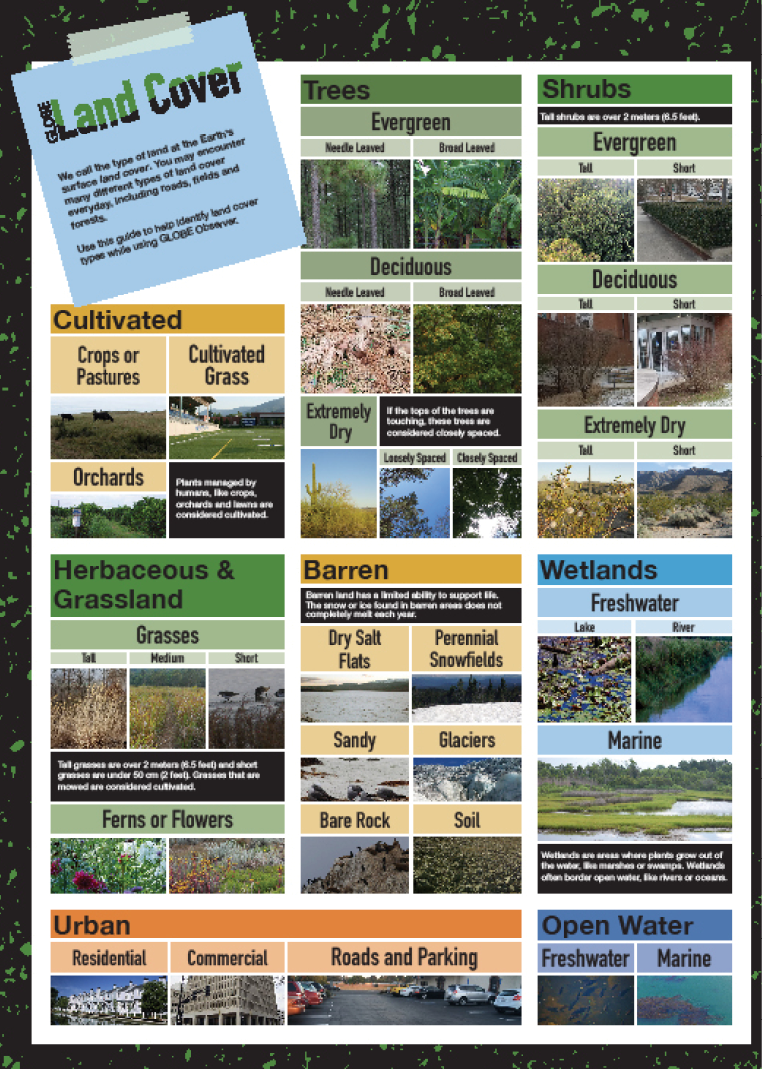
11. Check out: https://observer.globe.gov/toolkit/land-cover-toolkit/printables-and-promotional-materials and click on Land Cover Reference Guide for types of ground covers.
12. Consider this: if you are seeing all one type of plant growing in a large section of land, what can you say about the biodiversity of that land? Can you say that the land supports a diverse population of plants and animals? Does a monoculture of plant types support all the other living creatures who depend on a variety of species for food and shelter? If you think not, what options do we have to increase biodiversity in agricultural, food-producing lands?
Explore more
Ground Truthing: Drive out to the patterned area—the field that you found in Google Earth or Google Maps. What is being grown there? (It may be hard to tell if it is winter or early spring). Is it something you can eat, or is it meant for animals like cows? What’s around that spot? Is it more agricultural land, ranch land, or areas of town?
History of the Land: If you have internet access, explore the history of the land your home sits on. Was it always a town or was it once growing land? What’s the history of how people have lived on the land?


Meet the scientists: Selena Ahmed
Dr. Selena Ahmed is a professor of Sustainable Food Systems at Montana State University in Bozeman, Montana and runs the Food & Health Lab.
She studies food security and how food security can be strengthened by increasing the sustainability of our food systems for everyone—for local communities, for entire nations, and for the world as a whole. She also studies how our environment, the food we grow and eat, and our physical and emotional health are all connected. As she does her research, she prioritizes collaborating with many different groups and communities to make sure that her research considers different perspectives and can have a positive impact on the communities that need it the most.
On the WAFERx project, she is studying how potential climate change solutions could affect food security. For example, if land that was used to grow food is now used to grow bioenergy crops instead, how would this affect the amount of food that is available?

7. Soil Shakes: What’s Your Soil Made of?
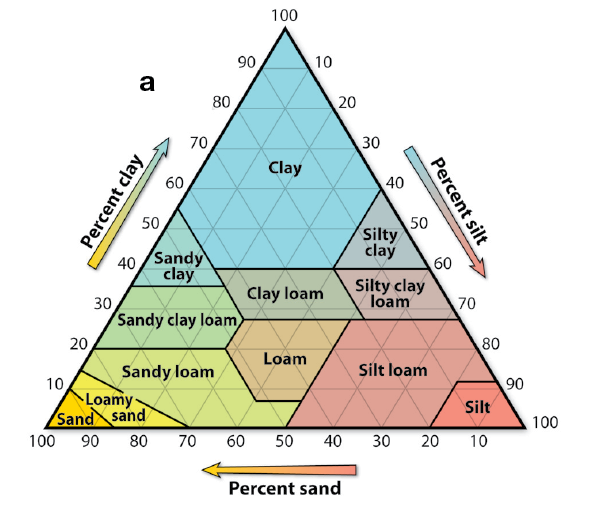
What kind of soil particles are in the soil where you live? In this activity, you will identify the types of soils where you live by taking a sample and analyzing it in a triangle soil chart.
Soils are special! Soils are the skin on our land: where plants anchor themselves, find water and draw in nutrients. Soils are the result of the breakdown of rock layers by five environmental factors: Climate, Organisms, Relief (landscape), Parent materials, and Time (CLORPT). Soil has four ingredients: minerals, living and dead organisms, air and water, that react with one another and make soil one of our planet’s most dynamic and important natural resources.
There are three major types of soil particles. Clay is the smallest and finest, then silt. Sand is the largest rockiest particle. All soils are combinations of the three particles. The ratios of the three particles give soil its texture. Various types of soil particles have different mineral content, based on their parent material, that determines its color. Soil particles form into a variety of types of small clumps called peds, which give soil its structure. The type of soil where you live is determined by its texture and structure.
Soils are amazing! Life as we know it would not exist without them, as they provide countless services that benefit all humans. Clean air and water, the clothes on our backs, habitat, and food for plants and animals are just a few things we can thank soils for. These ‘goods and services’ provided by soils are called ecosystem services.
Materials
- Clear container with a sealing lid
- Spoon or some other type of small scoop
- Enough water to fill container
- Water-proof marker
- Ruler or measuring tape
- Calculator
Prep for activity
Find a spot outside where you can take a small amount of soil, or bring in soil (about a cup’s worth) from another area.
Time and place
- Length of time: 15-20 minutes to fill container and take first measurement; 40 minutes to second measurement; 5-6 hours until third measurement and calculations
- Place: a working surface, a place where the containers can sit for a few hours, access to water
STEPS
- Find a clear glass or plastic wide-mouth jar or container (2 cups, 2 pints, or a 1 quart container, if possible). Have a way to close the mouth of the container securely, so you can shake it when it’s full of soil and water.
- Head outdoors with your container and a spoon. Find a small spot of bare soil and use your spoon to fill your container about half full.
- Make your soil into mud by wetting down the soil with water. Using a water-proof marker, draw a line at the top of the mud. Measure the depth of the mud in your container. This is your total soil depth.
- Fill the container with water.
- Shake up the mixture really well, until all the soil is suspended in the water.
- Set the container down and let the soil settle out for 40 to 60 seconds. Mark the level of the settled soil - this is the amount of sand in your soil.
- Let the container sit for another 5-6 hours or more (The next day is fine). Mark the level of soil. The difference between the first mark and the second mark is the silt portion of your soil.
- Measure and write down the depth of the sand layer and silt layer. Add the two layers together and subtract the combined amount from the total soil depth when you measured the mud. That remainder is the amount of clay in your soil. If you can let your container sit for several days, the clay may eventually settle out and you can measure the clay portion more accurately.
- To find out the percentage of each type of particle, divide each layer’s depth by the total soil depth. To accomplish that, make sure your measurements are all in the same units. For instances, convert your measurements to decimals, or measure in mm or cm. Check the triangle chart below to determine your soil type.
Explore more
NRCS - https://www.soils4kids.org/experiments and www.soils4teachers.org/lessons-and-activities#General5

Meet the scientists: Jack Brookshire
Dr. Jack Brookshire is an Associate Professor of Ecology and Bio-geochemistry in the Department of Land Resources and Environmental Sciences at Montana State University.
His studies focus on nutrient cycling—how nutrients move to and from the atmosphere and are transformed by microbes and plants. He also researches how ecosystems respond to changes in climate.
On the WAFERx project Dr. Brookshire is part of the team studying how much carbon could be removed from the atmosphere by growing bioenergy crops.
8. How Does Your Water Flow (in Plants and Soil)?
In this face-to-face group activity, students will learn: How does water move through our soils? What are water’s special properties that allow it to flow through soils, through plants, and through our houses. In this activity, you will act out how water flows through different types of soils.
Water movement through soils is called Soil Hydrology. Two major forces move liquid water through the soil pores: gravity and adhesion. Gravity is most important in saturated soils. It causes a downward force on water. When a soil is near saturation, the soil pores are filled and water moves rapidly through them. Soil texture, soil structure, and gravity influence water movement. Each of these factors is critical in how we understand soil hydrology concepts. Once we understand them, we can use them for agriculture, construction, and environmental sustainability purposes.
Soil porosity is the amount and size of gaps between soil particles through which water, air, plant roots and more can flow. Soils with primarily larger particles, like sand, can have larger, macro-sized pores, while the soils of smaller particles contain more micro-pore sizes. Clay particles are particularly small and flat, so particles can stack up like plates. Clay-dominated soils often have low porosity due to more micro-pores and low pore space, while sandy soils can have large numbers of macro-pores, creating high porosity.
Water will move in and out of these pores if they are connected to one another. These pores also allow water to enter the soil surface through infiltration, where water starts moving both laterally and vertically.
The term soil scientists use for the connectivity of soil macro- and micro-pores and how quickly water moves through them is soil permeability. High soil permeability means that the pore space in the soil is well-connected and that the pores are found throughout the soil. For instance, beach sand is highly permeable.
Soils with low permeability may have pores but those pores may not be connected. There may be very few pores. Once water reaches pores in low-permeability soils, it moves down the soil profile via gravity or will move laterally in the soil profile if there is enough pore space in that soil. This movement is aided by the capillary action of water in small spaces. Capillary action is the combination of water's ability to cling to surfaces (adhesion) and to itself (cohesion). Working together, cohesion and adhesion cause water to move itself through small spaces. The water will bind to the edges of the pores and slowly move laterally and even upward if the voids are small enough. You might see a puddle of water in this instance.
From: Soil Science Society of America (www.soils.org):https://soilsmatter.wordpress.com/2016/05/15/how-does-water-move-through-soil/
Materials
This activity can be performed with no materials, though several lengths (4–5 feet) of string or rope are helpful.
Prep for activities
- This activity works best with at least 6 people.
- Review the arm motions for each type of soil particle.
Time and place
- Length of time: 30-45 minutes
- Place: Large open area (indoors or out) that will comfortably hold all people standing up and moving around.
STEPS
This activity has at least four rounds of action. Each round will show how water can flow through soils made up of the different types of particles.
Divide your people in half between Soil Particles and Water Molecules.
The Soil Particle people will act out 1) sand, then 2) silt, then 3) clay particles. Have the Soil Particles stand in different configurations to mimic sand, silt and clay. (SAND – people stand arm’s length apart, SILT – people stand a forearm length apart, CLAY – people stand quite close) to show how water can flow at different rates between them.
Divide the Water Molecules into small groups of two or three people. Have all the Water Molecule people in each small group hold on to a length of string, or hold hands, so they are a chain of molecules and when one end moves, the others are pulled along, mimicking the adhesive forces in capillary action.
Have the Soil Particles act out SAND and all stand with arms’ length away from each other. Ask the Water Molecule groups to weave their way through the SAND particles. When all the Water Molecules are through, discuss for a moment how easily they were able to move through the SAND.
Repeat with SILT and CLAY.
Compare the experiences of moving through the different particle types. Discuss why it was easy or challenging to move through the three types of soil particles. Discuss changes in porosity if the soil held gravel.
Introduce plants and discuss what type of soils would be best for their roots to grow through the soil particles and which would be best for holding water that plant roots could use it.
ASK: Why does this matter for plants? Do you think certain plants can adapt to different types of soils? Does there seem to be an ideal type of soil for plants? Which soil do you think would be hardest for plants to live in? What actions do people take that could harm soils?
CHALLENGE: Have the Soil Particle people mix up their particle types to be a much more realistic soil. Each Soil Particle person makes their own choice about what type of particle they want to be. Have the Water Molecule groups move through the soil now, and then discuss that experience. How do you think plant roots would react in a mixed soil?
Explore more
Perkin’ Through the Pores–Utah AITC Dirt: https://utah.agclassroom.org/soil/
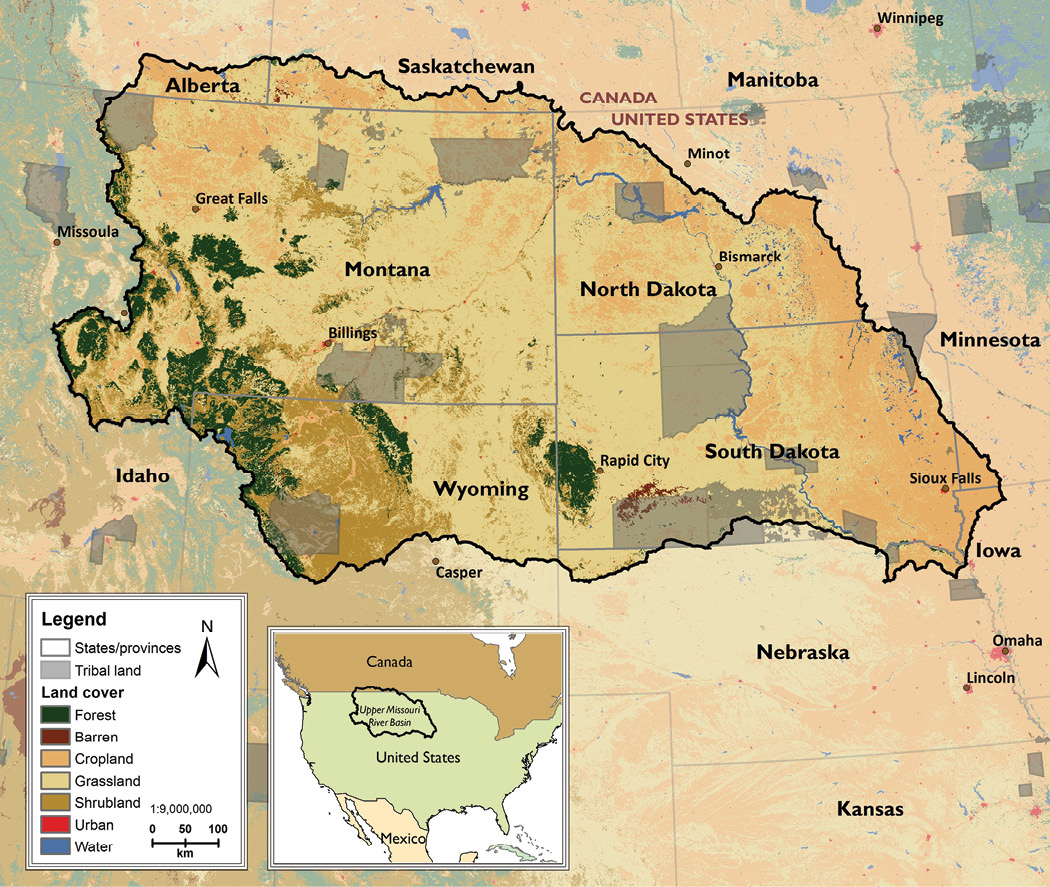
WAFERx and the Upper Missouri River Basin
Our research is focused on the Upper Missouri River Basin (UMRB).
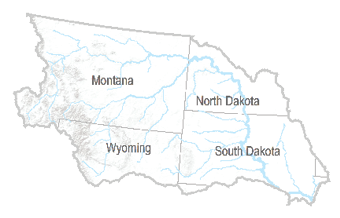
Crops and pasture lands cover almost a quarter of this region's 188 million acres, and it is a very important agricultural region of the United States. The UMRB is only 8% of the total land area in the U.S., but it produces 30% of the wheat, 13% of the soybeans, 11% of the cattle, and 9% of the corn in the USA.
The Upper Missouri River Basin also has the potential to produce lots of crops for bioenergy, and it contains several places with the potential for geologic carbon capture and storage (a process that involves capturing carbon emissions and storing them deep underground—see p. 10). The WAFERx team wants to know what might happen to the people, wildlife, communities and economy of the UMRB if we increase bioenergy crop production and see widespread adoption of carbon capture and storage.

9. What Does the Land Look Like from Above?
The patterns of land use can be beautiful – a combination of form and function. When you look at land use from a bird’s eye view, you see the intersection of how people use the land with the natural landscape formed by water and rock, soil and climate.
In this activity you will recreate your own personal landscape, seen from above, out of bits of paper – green for grass, dark green for trees, gray for houses, black for streets and pavements, etc. Drawing inspiration from satellite images of where you live, you will decide how to depict the landscape you live in by creating a collage, or mosaic, out of paper.
Materials
- A selection of squares or torn pieces of colored construction, tissue, or other paper - green for grass, dark green for trees, gray for houses, black for streets and pavements, browns for bare fields, blue for streams, rivers and lakes, etc. Pick a special color for your house.
- Arrange the different colors of paper pieces in separate bowls, plates, or bags for easy access.
- Glue sticks, or paper plates with white glue and brushes
- Cardstock for the base of your picture (white would be best)
- Pencil and eraser
- Paper towels and water handy for clean-up.
- Optional: Mod Podge or other acrylic finishing product
- For reference: a photo or map of where you live, either through access to the internet – for Google Maps or Google Earth, or an alternate option – a map of your town, county or state.
Prep for activities
You will need a flat working surface (not windy!) that is protected from glue spills. If you won’t have Internet access for this activity, download and print some maps of your area ahead of time.
Time and place
Length of time: About 1 hour
Place: your home, at a kitchen or dining room table, or another spot with table space.
STEPS
- Assemble your materials.
- Choose the image you will be referencing.
- Lightly draw the image you chose onto your base of cardstock or other paper.
- Decide which color will represent what landscape element in your image.
- Decide where to start for your mosaic (the middle of the cardstock may be easiest).
- Glue the colored paper pieces down one at a time, following your drawing. You may overlap the colored pieces or set them next to each other without overlapping.
- If you chose an area that includes your home, be sure to place your own home on your picture.
- When you are finished, you may need to let your picture dry before you move it.
Optional: paint an acrylic finish coat (like Mod Podge) over your picture to preserve it.
Explore more
Create a collage of pictures from magazines that represent where you live.
Create a mosaic of your state: https://thecraftyclassroom.com/crafts/geology-crafts-for-kids/physical-map-collage

Above are two examples of some Internet maps you could find and print out. Vermillion, South Dakota is on the first and Culbertson, Montana is next. Both communities are near the Missour River.
You can make a mosaic (like the one of Oregon, above) that shows the types of land cover in your state.
 Studying land cover
Land cover is what is on the surface of the Earth. It includes things like trees, grass and flowers, rocks, cultivated land (like a park or wheat field) and urban land.Land use is different—it refers to how people use the land, such as for recreation, wildlife habitat or agriculture.
Scientists study land cover because some types of land cover could increase a community’s risk of certain disasters, like flooding, fires or landslides; while other types of land cover, like forests, can absorb carbon dioxide and decrease the effects of climate change.
Historical maps help us see changes over time and also help us plan for the future. For example, plant-covered lands are generally cooler than urban lands covered in cement, metal and asphalt, so if you see lands in your community that were once open space or croplands but are now parking lots or buildings, they will likely be warmer than before.
Land cover can be determined by analyzing satellite and aerial imagery, but scientists also rely on human observers who can see much greater detail than a satellite can (see Activity #6 on Food Production and Activity #11 on Citizen Science)
Walk outside—what kinds of land cover do you see? You can download a chart like this at:https://observer.globe.gov/do-globe-observer/land-cover
.png)

10. What Do You Value About the Land?
The land we live on has many uses. Some of those uses we may take for granted, such as the land our houses and buildings are on. Some uses we appreciate for fun and pleasure, like parks, scenic areas, or to play sports. Other uses are fundamental to our lives, as when the land is used for growing the food we eat and the food that domestic animals eat. Land provides resources like water, minerals, oil and gas, coal, and wind that power our world.
Land is also critical to other living beings. It’s where they find food, shelter, water, and other members of their species; all that’s needed for them to survive and thrive. Land that supports a broad range of plant and animal communities has high biodiversity, a sign of a healthy ecosystem.
The researchers on the WAFERx team study how different land use systems affect one another. If the way we use agricultural lands changes, then wildlife may be impacted. If we discover a new energy source, then human communities may be affected. Of course, every change and decision has a trade-off. Different people value different uses of the land.
Have you ever thought about what uses of the land are important to you? In this activity you will consider that question. As you answer the questions and rate the different land uses in the four surveys to follow, you will gain a sense of the different activities that land is used for. In your answers, you will begin to discover what you feel are the most important uses for the land around you. Every person will have different ideas on valuing the land!
Materials
- Copies of the four surveys, a pencil (surveys are below or download as PDFs)
- Optional: Land Use Explorer Card Deck (download here)
Prep for activities
Consider and discuss the types of land uses that are prevalent in the land around where you live.
Time and place
- Time: the surveys may take 20-25 minutes to complete
- Place: Your own home or in a group setting.
STEPS
- Look through the four different surveys to get a sense of the different land uses being considered. If any are unknown to you, take a moment to do a little research to learn more about that land use.
- Starting with the first survey, fill each out as accurately and truthfully as you can. This is for your own information; you can share your thoughts and opinions if you choose to.
- When you’ve completed the surveys, fill out the Your Choices Chart with your first and last choices from each survey. Look for the patterns in your choices. Can you say what your own land use values are?
- Consider the land around you, where you live, and how your land use choices match or fit with the uses of the land around you. What kinds of conflicts do you see between your choices of how land should be best used and how it is currently being used? How could those conflicts be resolved?
Explore more
Not all land uses are compatible with each other; sometimes it is necessary to choose one or two land uses over some or many of the others. The question of which uses should be chosen often has a complex answer. Many factors need to be considered and each factor judged for which ones have the most weight.
Find a recent case of land use decision-making in your area. Determine the different factors that were involved and learn how the land use decision was made. How was the decision made? Who were the people involved, and what did each person or group want to do with the land? Could the land have been used for more than one of the proposed uses? Why or why not?

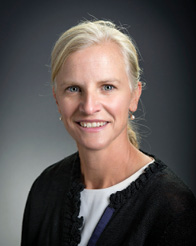
Meet the scientists: Meghann Jarchow
Dr. Meghann Jarchow is Chair and Associate Professor in the Department of Sustainability and Environment at the University of South Dakota.
She has expertise in prairie plants, bioenergy, and sustainability. Her research focuses on creating landscapes that have multiple functions and on sustainability education. She thinks of studying sustainability as a way to ask, “What kind of world do we want?” and “How can we effect change to create that world?”
On the WAFERx project Dr. Jarchow is mapping social values across the Upper Missouri River Basin (UMRB). She is working with graduate students in the Department of Sustainability and Environment to understand what people value about the landscapes of the UMRB and how those values are changing.

Survey 1: Rate how much you value having the pictured activities on the landscape in your area
|
Strongly value |
Somewhat |
Neutral |
Do not value |
Strongly do not value |
|
|
Livestock |
|||||
|
Native plants and animals |
|||||
|
Wind power |
|||||
|
Energy extraction |
|||||
|
Development |
|||||
|
Crops for biofuels |
|||||
|
Crops for animal feed |
|||||
|
Crops for human food |
|||||
|
Hunting or fishing |
Survey 2: How often is the land around you used for the following activities?
|
Often |
Sometimes |
Almost never |
Never |
|
|
Farming/ranching |
||||
|
Fossil fuel extraction |
||||
|
Hunting |
||||
|
Sightseeing/visual |
||||
|
Hiking/other outdoor recreation |
||||
|
Economic/resource production |
||||
|
Community building |
||||
|
Water recreation |
Survey 3: Consider what may be on the land around you in the years to come.
How important is it to you for each of these to be part of the landscape in the future?
|
I strongly desire this on the landscape |
I somewhat desire this on the landscape |
Neutral |
I do not desire this on the landscape |
I strongly do not desire this on the landscape |
|
|
Energy extraction |
|||||
|
Wildlife |
|||||
|
Outdoor recreation |
|||||
|
Wind energy |
|||||
|
Hunting |
|||||
|
Open space |
|||||
|
Agriculture |
|||||
|
Native landscape |
|||||
|
Development |
|||||
|
Biofuels |
Survey 4: Circle the FOUR land uses that are most important to you from the list below. You have 100 points to divide up among those four. How would you assign the points? What values are most important to you on the land around you?
|
Value Choices |
Points |
Reasons why you chose this value |
|
Agricultural |
||
|
Aesthetic (what is attractive about the land) |
||
|
Community building |
||
|
Conservation and taking care of the land |
||
|
Cultural |
||
|
Development |
||
|
Economic |
||
|
Energy |
||
|
Recreational |
||
|
Spiritual/religious |
||
|
Tourism |
Your Choices Chart: List Your Personal Choices –
What patterns do you see?
When you’ve completed the surveys, fill out this chart with your first and last choices
from each survey.
Look for the patterns in your choices. Can you say what your own land use values are?
|
Survey |
What are your top choices? |
What are your last choices? |
|
#1 |
||
|
#2 |
||
|
#3 |
||
|
#4 |
||
|
What conclusions can you draw about your land use values? |


11. How Can I Take Action? Be a Citizen Scientist!
In this activity, you will think about your relationship to the land around you and explore some ways you can contribute your own data and observations by becoming a citizen scientist.
A Citizen Scientist is a member of the general public who collects and analyzes data relating to the natural world, often as part of a collaborative project with professional scientists. Citizen science is sometimes described as “public participation in scientific research.” Through citizen science, people share and contribute to data monitoring and collection programs.
Materials
- A journal or paper to write down your thoughts.
- Internet access
- A cell phone or tablet to download apps such as GLOBE Observer
Prep for activities
This can be a solo activity or a group discussion and activity. Internet access can be an important element to access citizen science apps such GLOBE Observer.
Time and place
- Length of time: 30 minutes to 1 hour, initially. Recurring involvement can take several minutes or more.
- Place: Your own home, or a place where you have gathered with a group to discuss land use practices and being a citizen scientist.
STEPS
- Have your journal or piece of paper ready to write.
- Sit and think quietly for a few minutes. Consider what you know about the land you live on and what it means to you.
Ask yourself these questions:
- What does the land provide for me?
- How do I relate to the land?
- Do I take care of the land? If I do, how?
- Who else needs and uses the land besides me?
- What’s my responsibility to the other living creatures who live on the land with me?
- What is a way to take action and learn more about the land?
Write down your thoughts, or discuss them with the other people in your group.
Consider how you can learn more – both about the land you live on and those people who study the land – scientists, such as those who work in government agencies who are responsible for, and charged with, learning about and managing land use.
One way to help out and learn more is to be a Citizen Scientist. With a smart phone or tablet, download the GLOBE Observer app and make a free account
GLOBE Observer’s Land Cover tool will help you document what is on the land (land cover). You will report on current surface conditions, then take photographs in all four cardinal directions, plus up and down. You can also classify the land cover in your photographs (the app teaches you how), reporting on whether it is grassland, a forest or an urban area. You can even compare your classification to a satellite land cover observation and note any differences.
Land cover is the base dataset for many areas of critical science, including hazard analysis for floods, fires and landslides, mapping wildlife habitat, and tracking the impacts of climate change. Even though land cover is familiar to everyone on the planet, the most detailed satellite-based maps of global land cover still do not give as much detail as you can give through a photo at ground level. Your work matters to the WAFERx scientists and others who study our planet Earth and all its systems.
Explore more
- Citizen Science.gov—US. Government website specifically designed to get citizens involved and collecting data:
- SciStarter—Science we can do together:
- NASA: https://science.nasa.gov/citizenscience
- National Geographic Society
- Scientific American:
- Zooniverse—People-powered science:
- Science Friday: www.sciencefriday.com/segments/
citizen-science-quarantine/ - The Field Guide to Citizen Science: How You Can Contribute to Scientific Research and Make a Difference, by Darlene Cavalier, Catherine Hoffman, and Caren Cooper
Do you have any feedback on Land Use Explorers, or are you interested in receiving copies to use with a group of youth? Please contact the MSU Science Math Resource Center at smrc@montana.edu